How Coal Country Went Conservative: An electoral analysis of the Wyoming Valley
The Wyoming Valley is made up of Lackawanna, Luzerne, and Wyoming Counties, though the physical valley is ironically only located in Lackawanna and Luzerne. Despite the fact that it's a rather small region of around 500,000 people, its political importance is quite outsized relative to its size. Firstly, the Wyoming Valley is in Pennsylvania, which is quite frankly the most important state out of the fifty in our union–Pennsylvania has been the tipping point state (the state that mathematically decided the winner) in the past three Presidential elections (2016, 2020, and 2024). Still, that is a fact shared by the other approximately 12.5 million Pennsylvanians who don’t live in the region so what makes the Wyoming Valley especially politically important? Well secondly, the majority of the district is also located in Pennsylvania’s 8th Congressional District which is one of the most competitive house seats in the nation (flipping Republican by 1.62% in 2024, being the 9th closest House race out of 435). Furthermore, the region is home to plenty of competitive State House of Representatives districts, adding to the region’s importance. With all of this in mind, perhaps the region’s greatest political importance comes from its symbolic value–that is that the Wyoming Valley tells the story of the death of a faction of the democratic party–and how the republican party swept in and changed the region's political geography forever.
The Wyoming Valley was originally inhabited by the Lenape (Delaware) people and faced light settlement during the initial colonial era. The region was contested between Connecticut (Yankees) and Pennsylvania (Pennamites) leading to the Pennamite-Yankee Wars, a series of skirmishes between settlers leading to Pennsylvania’s eventual victory. Still, the region remained rather quiet until the late 1800s with the anthracite coal boom. Almost overnight, the region became a major industrial and mining hub, leading to an influx of immigrants primarily from Ireland, Poland, Italy, and other Eastern European countries. Like many other regions in the county, the combination of industry and immigration led to the creation of ethnic enclaves (Italians in Old Forge, Polish in Nanticoke, etc), often anchored by their local catholic church. Also like many other regions, class politics became increasingly prominent with a strong mine/factory owner vs laborer dynamic.
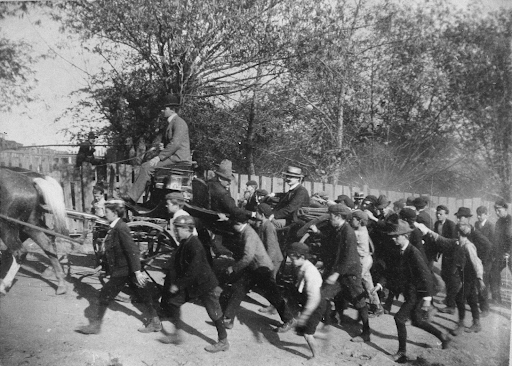
In the 1900s the region became a center of strikes, union organizing, and in turn, repression. The 1902 Anthracite Coal strike in Scranton marked the first labor dispute in which the U.S. federal government (through President Theodore Roosevelt) intervened as a neutral arbitrator–leading to the miners receiving a 10% wage increase and a workday reduction from ten to nine hours. Naturally, the region became a Democratic party stronghold and with that came the emergence of local Democratic Party machines. Often tied to unions and ethnic networks, these political machines created a culture of patronage politics where jobs, contrasts, and favors were controlled by local political elites. As the decades moved on, the decline of coal began, culminating in the 1959 Knox Mine Disaster which symbolically ended the region's mining industry. Due to this along with general deindustrialization, the region faced massive job losses leading to seismic outmigration, poverty, and general community and social decline. The region's population peaked at 771,023 in the 1930 census, a far cry from today’s 567,559 marking a 26.3% decline despite the United State’s population increasing 169% in the same time span.
With massive depopulation, long-term unemployment, and underinvestment in infrastructure and education, civic institutions weakened and brain drain became a structural problem–I personally am an example of this, being born in Scranton, going to college in Pittsburgh, and unlikely to find a job in my intended career field back at home. With this, the region’s loyalty to the Democratic party persisted but became less ideologically coherent with increasing divides between conservative democrats and more progressive democrats. The region’s whole political dynamic drastically shifted with Donald Trump’s introduction to politics. As politics became less economic based, and more social, cultural, and identity based, Trump’s populist rhetoric naturally appealed to the region. Like many rustbelt regions, the area’s politics can be overly simplified into being economically left-leaning and socially right-leaning–but as politics shifted from an economic focus to a social and cultural focus, the region’s voting behavior has naturally shifted. Still, also like many rustbelt regions, the region exhibits downballot lag where Democrats tend to perform substantially better in local and state races (and to a smaller extent non-presidential federal races). The purpose of this article is to tell the story of this shift.
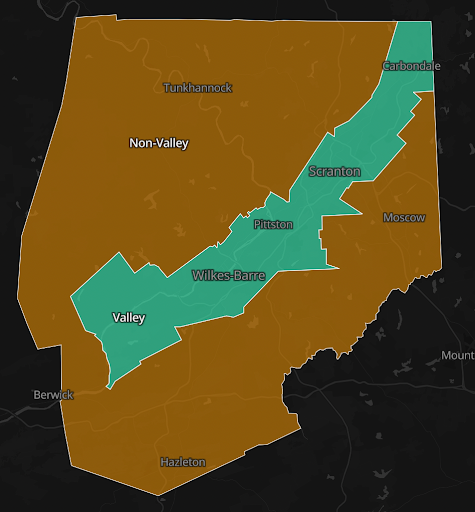
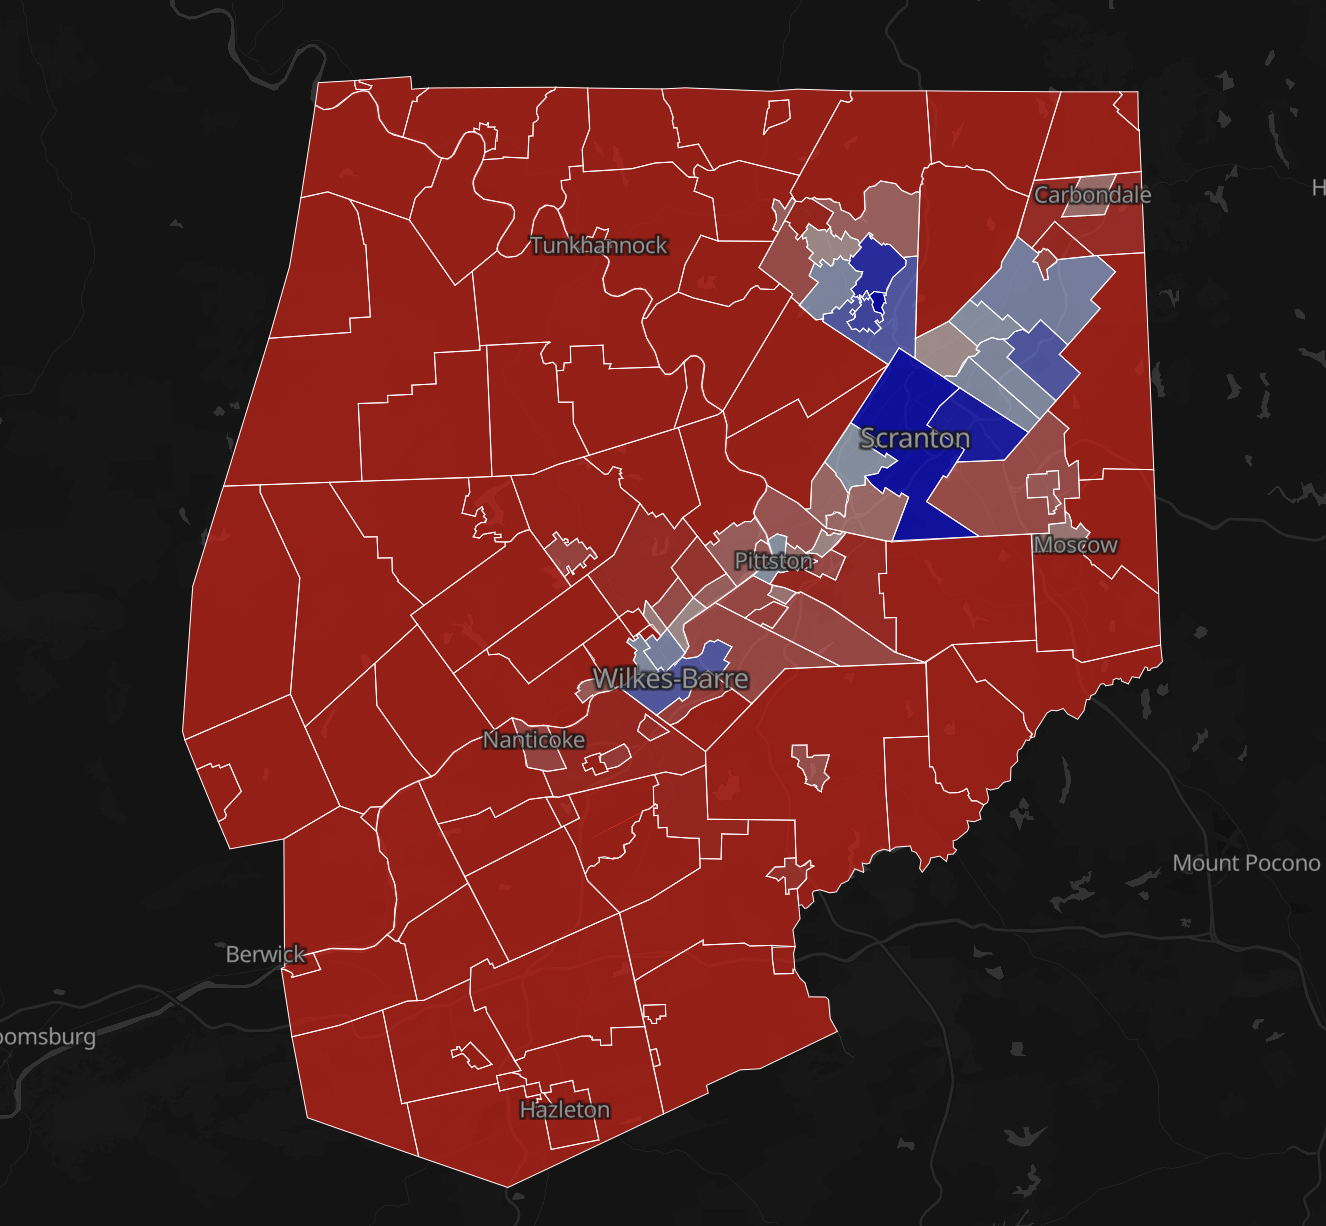
The region of “Wyoming Valley” can be split up into the municipalities located in the physical valley cut through by the Susquehanna and Lackawanna Rivers and those that fall outside the physical valley but are still part of the cultural and social region. The physical valley was developed first, and is accordingly home to the two anchor cities of the regions: Scranton and Wilkes-Barre, and the other surrounding “valley towns” which are quite similar in terms of urban layout. These valley towns have a surprisingly high population density similar to many mid-sized cities, but also were the larger victims of depopulation and industrial decline. They have a much more Democratic voting history, voting for Obama in 2012 by almost 29 percentage points, not voting Republican until 2024 when Trump won “Valley Towns” by a mere 0.57 percent.
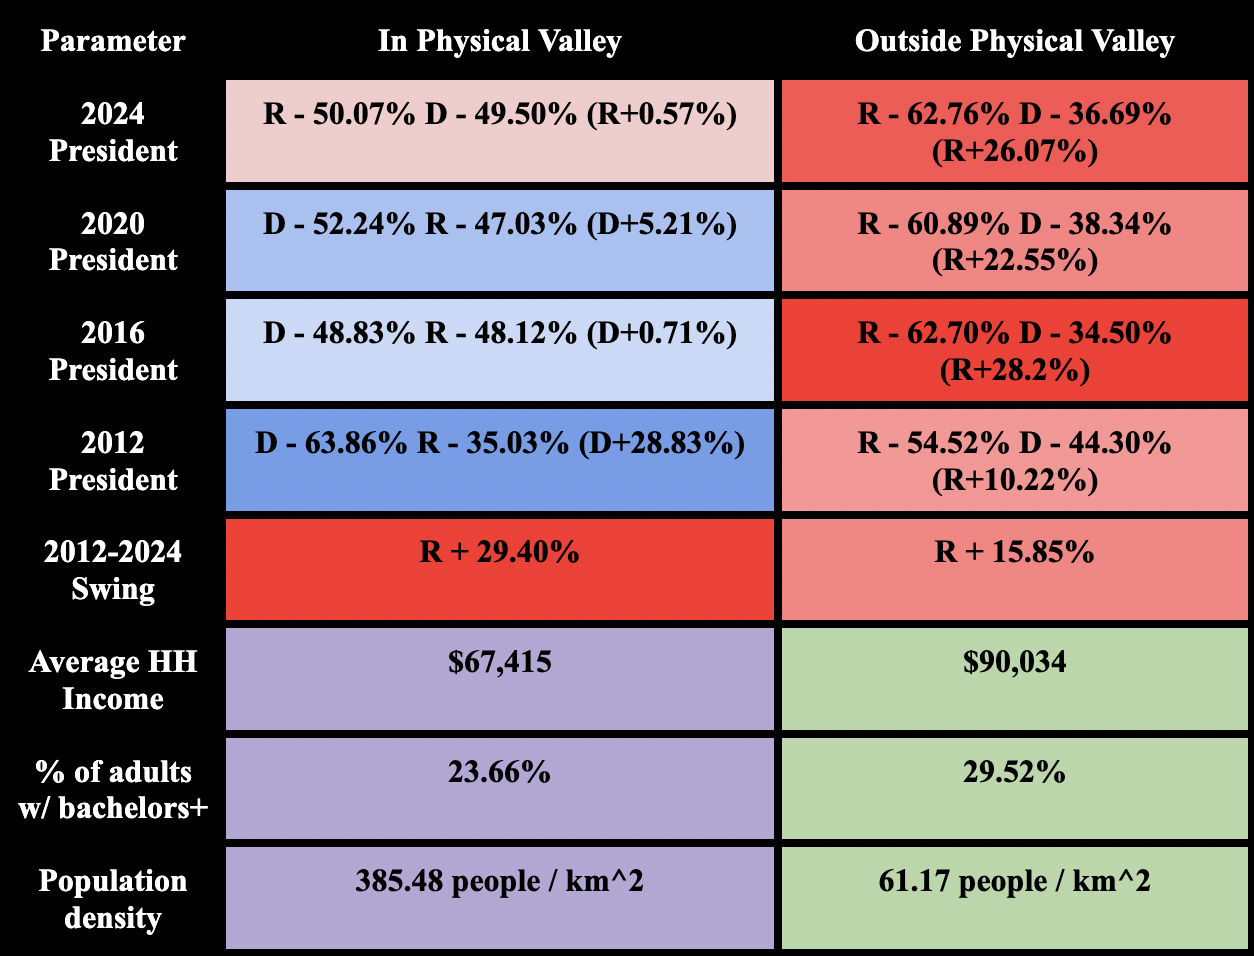
By contrast, the area outside of the valley is much more rural, home to only a couple small towns such as Clarks Summit, Dallas, and Moscow, along with the city of Hazleton. Being less industrial and mining based, the area outside the physical valley was much less ancestrally democratic–voting for Mitt Romney over Barack Obama by 10.22 percent in 2012. Still, like the rest of the region, the area outside the valley got much redder with Trump’s emergence on the political stage, but to a lesser degree to the “valley towns” who swung 29.40 percent between 2012 and 2024 to the “outside the valley towns” who “only” swung 15.85 percent.
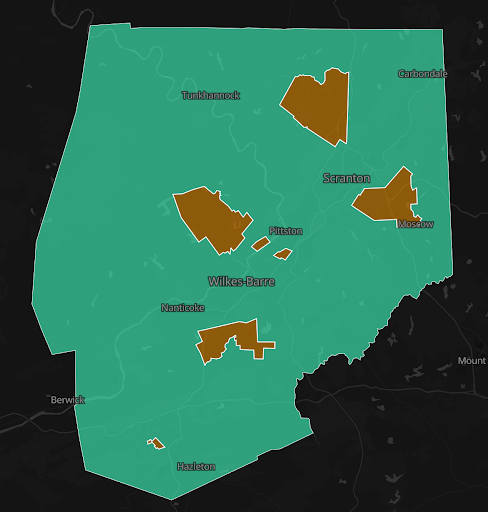
In general, the Wyoming Valley is not a very affluent area. The average household income of the region is $63,656 compared to the statewide average of $77,500 and only 25.98 percent hold a bachelor’s degree compared to 36.50 percent statewide. Still, the region does hold pockets of affluence. I defined affluent regions as municipalities where 40 percent or more of the adult population hold a bachelor’s degree which creates this map where orange shows “affluent” areas and the teal shows “non-affluent” areas.
Following National Trends, the affluent areas resisted the Trumpian rightward shift while nonaffluent areas swung very far to the right. In fact, Mitt Romney won the affluent areas by 4.21 percent in 2012 despite losing the region at-large. Trump expanded that margin to 12.68 percent in 2016 but his margin in the affluent region fell back to 3.86 percent in 2020 (a smaller margin than Mitt Romney in 2012 who won by 4.21 percent). He was able to recover his lead a bit in the affluent region though in 2024, winning by 5.91 percent–a greater republican victory than in 2012 or 2020, but smaller than in 2016. Overall, the 2012-2024 shift in the affluent areas was a rather small R + 1.70 percent swing. By contrast, the nonaffluent region voted heavily for Obama in 2012 by a whopping 15.72 percent margin. This rather large democratic party lead was demolished in 2016 when Trump won the nonaffluent region by 10.75 percent. In 2020, Biden was able to cut into Trump’s margin, but to a lesser degree than he did in affluent areas, cutting Trump’s margin to 6.59 percent. In 2024, Trump scored his largest margin of victory in the nonaffluent region, winning by 11.90 percent. Still, the story of the Wyoming Valley’s electoral swings can’t just be seen through cutting the region into binary regions, so after a brief review of the four presidential elections in the region at-large, the rest of this article will be exploring certain towns and subregions to help paint a clearer picture of the Wyoming Valley’s politics.
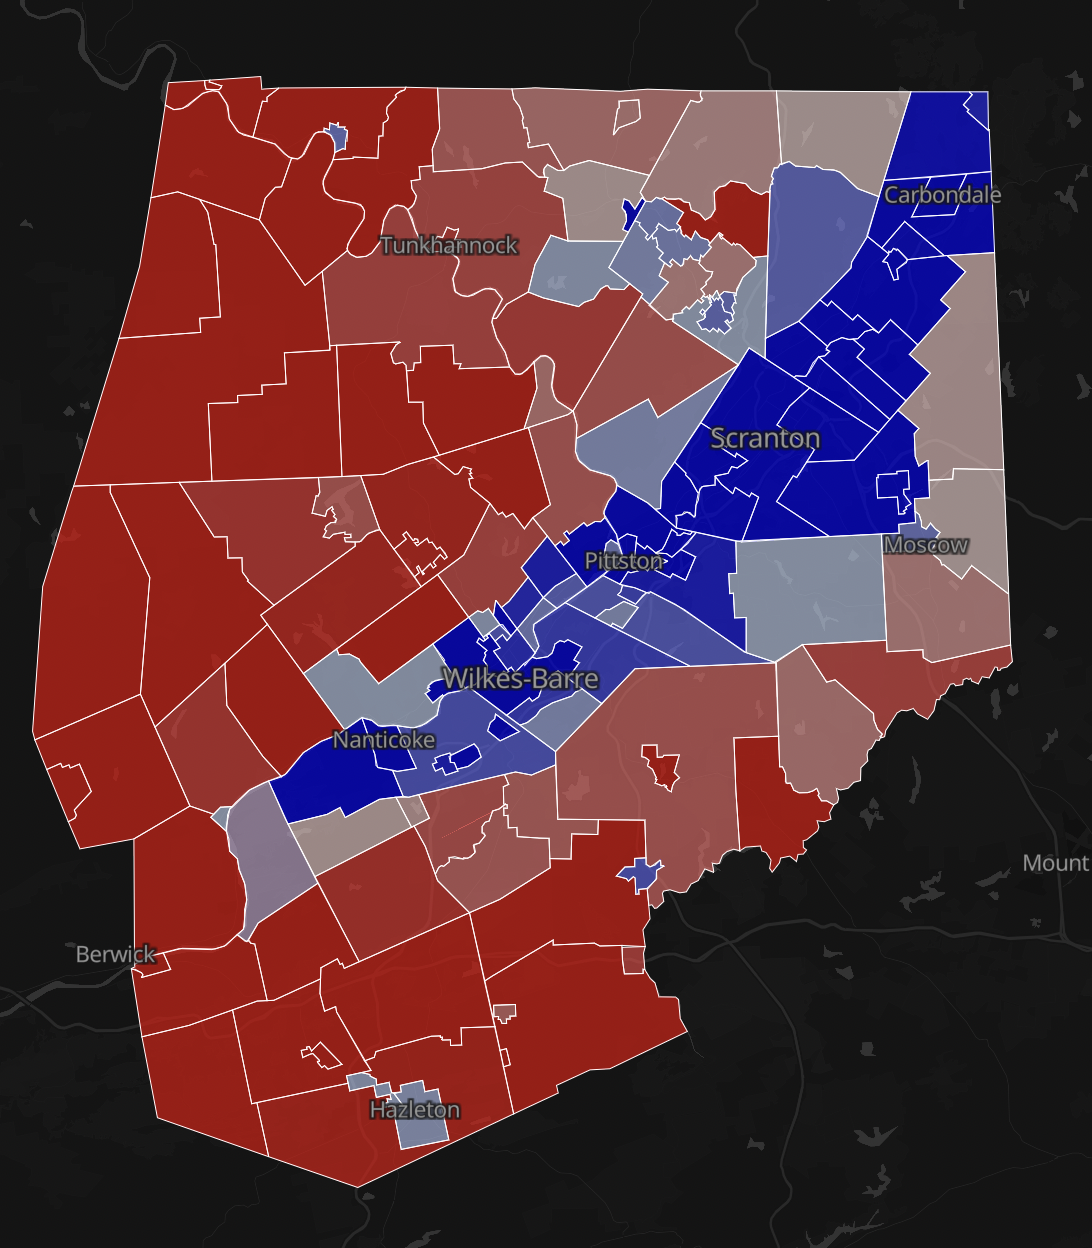
In 2012, the region still held on to its democratic party loyalties, backing Obama by a healthy 13.05 percent margin. The cracks in the local democratic party hadn’t quite yet emerged as Obama won valley towns by margin often ranging from 20 to 40 percent, while still showing respectable showings in the non-valley rural areas of the region.
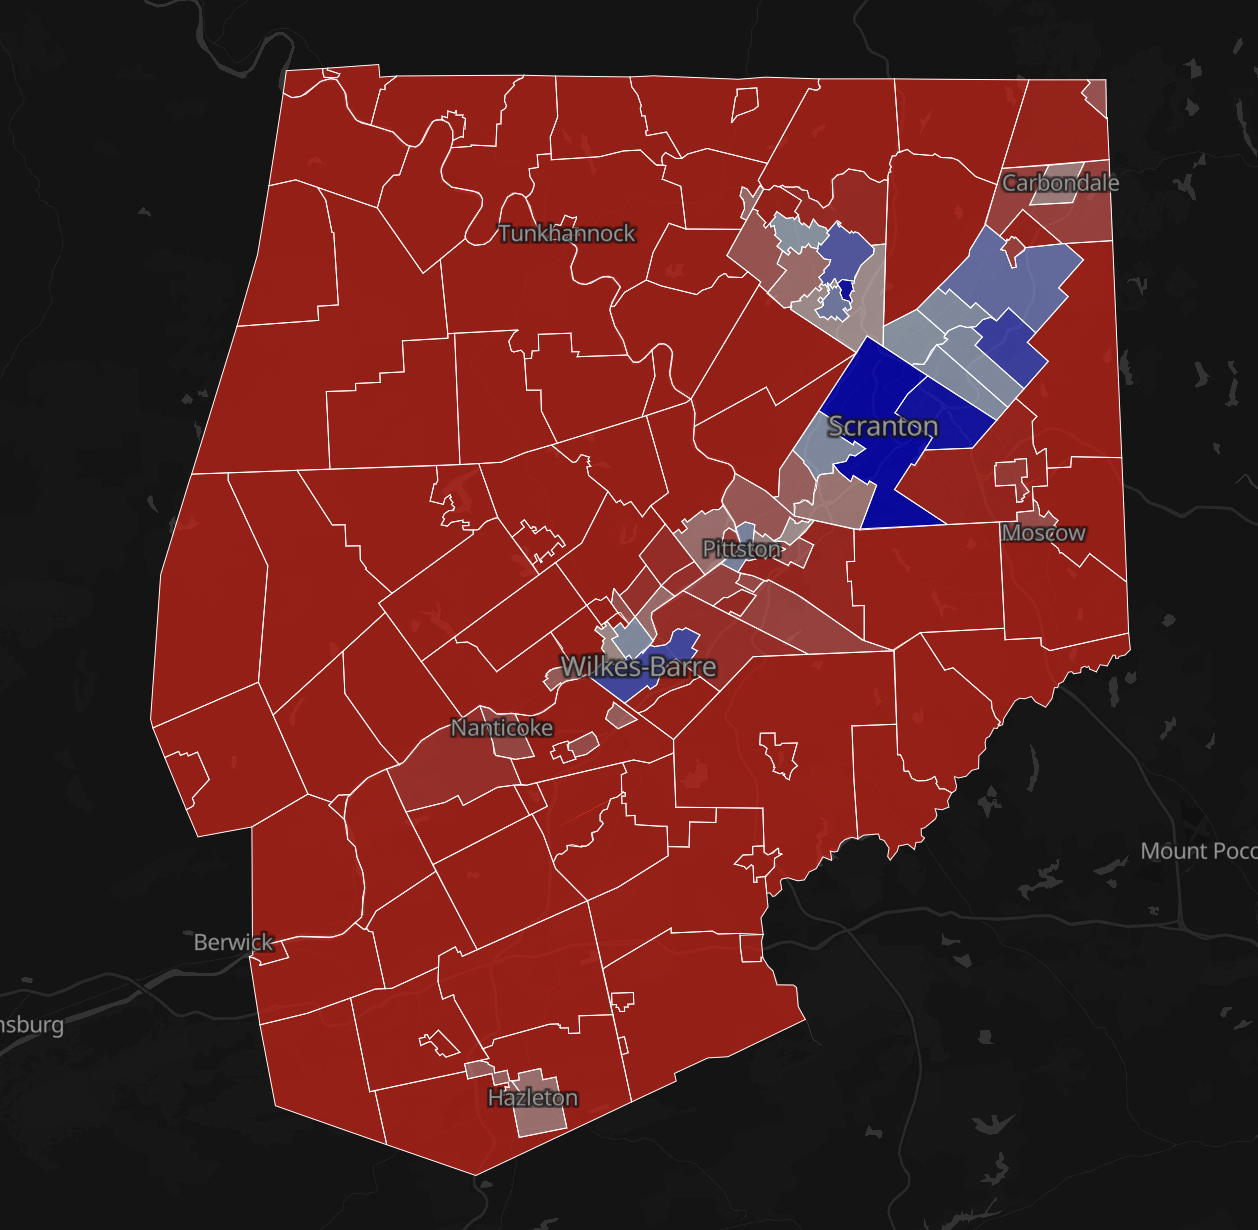
This completely changed in 2016 with Donald Trump. Tapping into populist, anti-elite rhetoric–Trump railed against trade deals formerly supported by the republican party that among many other things, furthered the process of deindustrialization that devastated the region. He also dropped the republican party’s rhetorical focus on cutting welfare benefits which the region relies on more prominently than the rest of the state–in effect moving the republican party (again rhetorically) leftwards closer to the median voter in the Wyoming Valley, while also playing into their anti-elite, socially conservative leanings. Like in many other rustbelt regions, Trump destroyed the democratic lead in the region, flipping it republican by 11.99 percent (a whopping 25.04 percent swing).
Born in Green Ridge, a northern neighborhood of Scranton, Joe Biden provided temporary relief for democrats in the region. He improved democratic margins across the region, from rural to urban areas alike–in the end cutting Trump’s 10.99 percent margin of victory down to 6.23 percent. A common question for political scientists is do politicians nowadays (years ago they certainly did) still receive a hometown advantage (that is, do they perform better electorally in their home regions)? It is difficult to say for certain due to the amount of confounding variables involved in how people vote–but the fact that Biden improved democrat’s margins by 4.76 percent in a state where he improved the margin for democrats by only 1.88 percent suggests that may be so–especially when considering the demographic profile of the region doesn’t fit the typical demographic profile of areas that swung heavily toward Biden in 2020 (that is affluent). Indeed we do see a divide in swings between the affluent and nonaffluent areas of the region, with the affluent regions swinging 9.21 percent toward democrats between 2016 and 2020 while the nonaffluent regions only swung 4.43 percent toward democrats in the same timeframe.
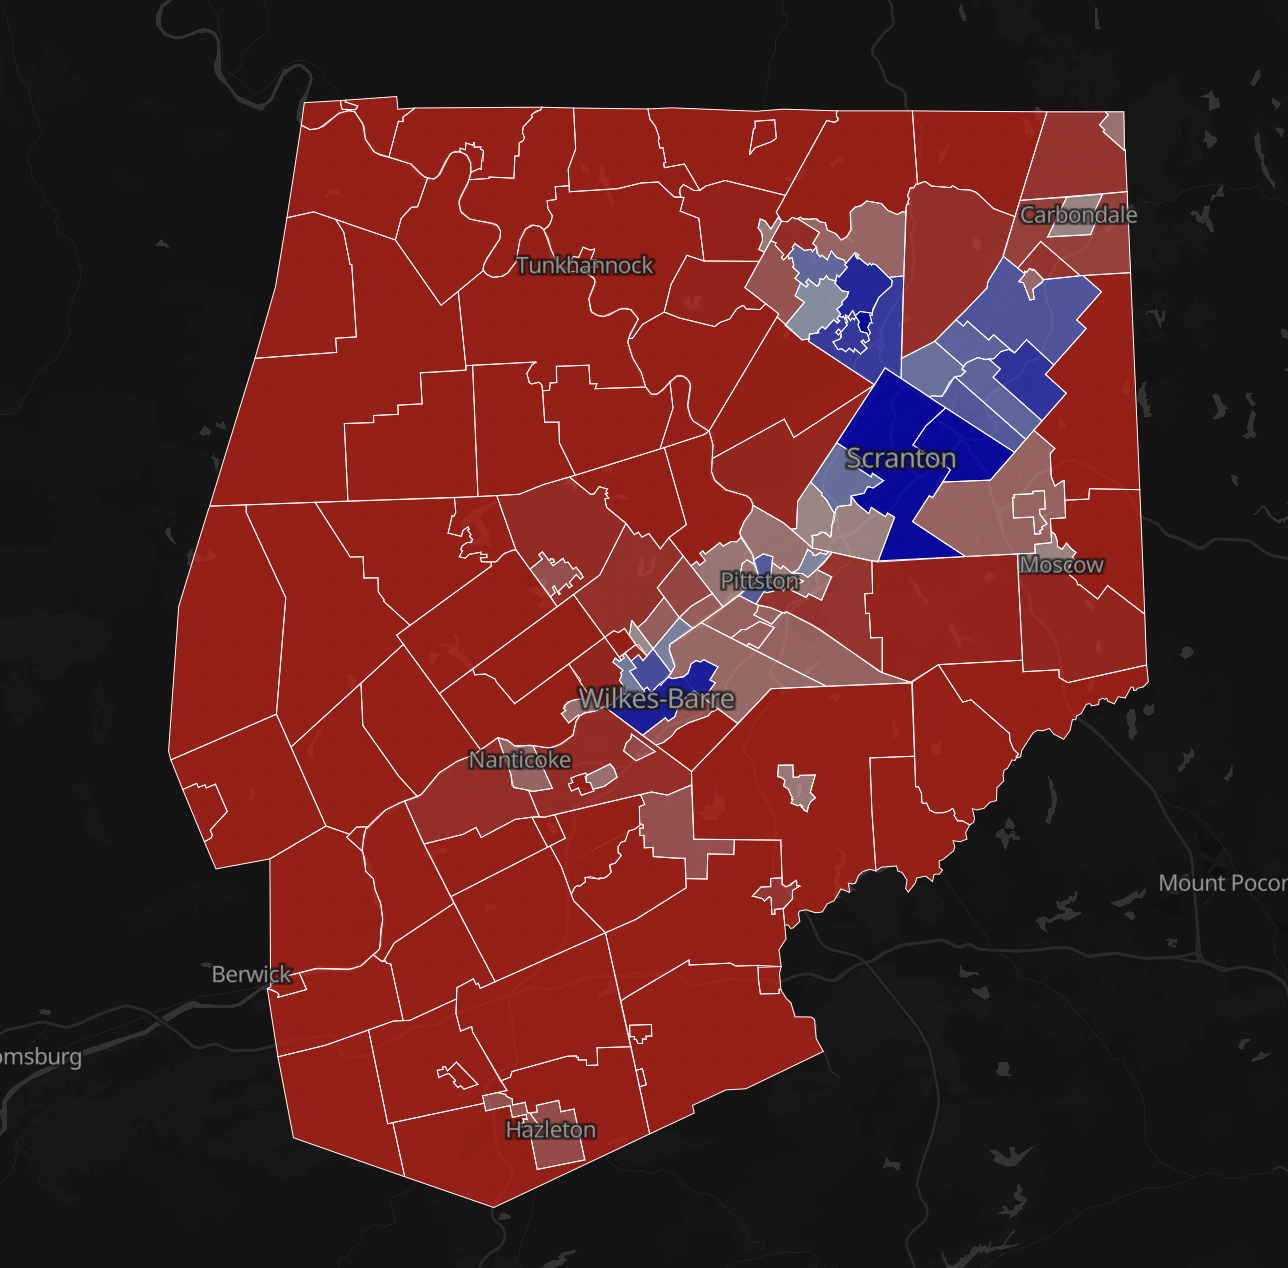
2024 was not a good year for democrats and that was especially true in the Wyoming Valley. Hit especially hard by inflation (both by nature in it being a poorer region and statistically facing higher than average rates of inflation), the region swung heavily back toward Trump, leading to his widest overall margin of victory of 11.23 percent. Similar to Biden’s swing from 2016-2020, Trump’s swing was remarkably uniform across the region–still some patterns emerged where he improved more in non-white and poorer areas similar to the national trend. Interestingly, 2024 also saw the defeat of (most) of the region’s democratic congressman Matthew Cartwrtight who lost to Rob Bresnahan by less than two percent despite Kamala Harris losing the district by around ten percent. This perhaps put a symbolic nail in the coffin of the Wyoming Valley democratis–or perhaps not–who knows?
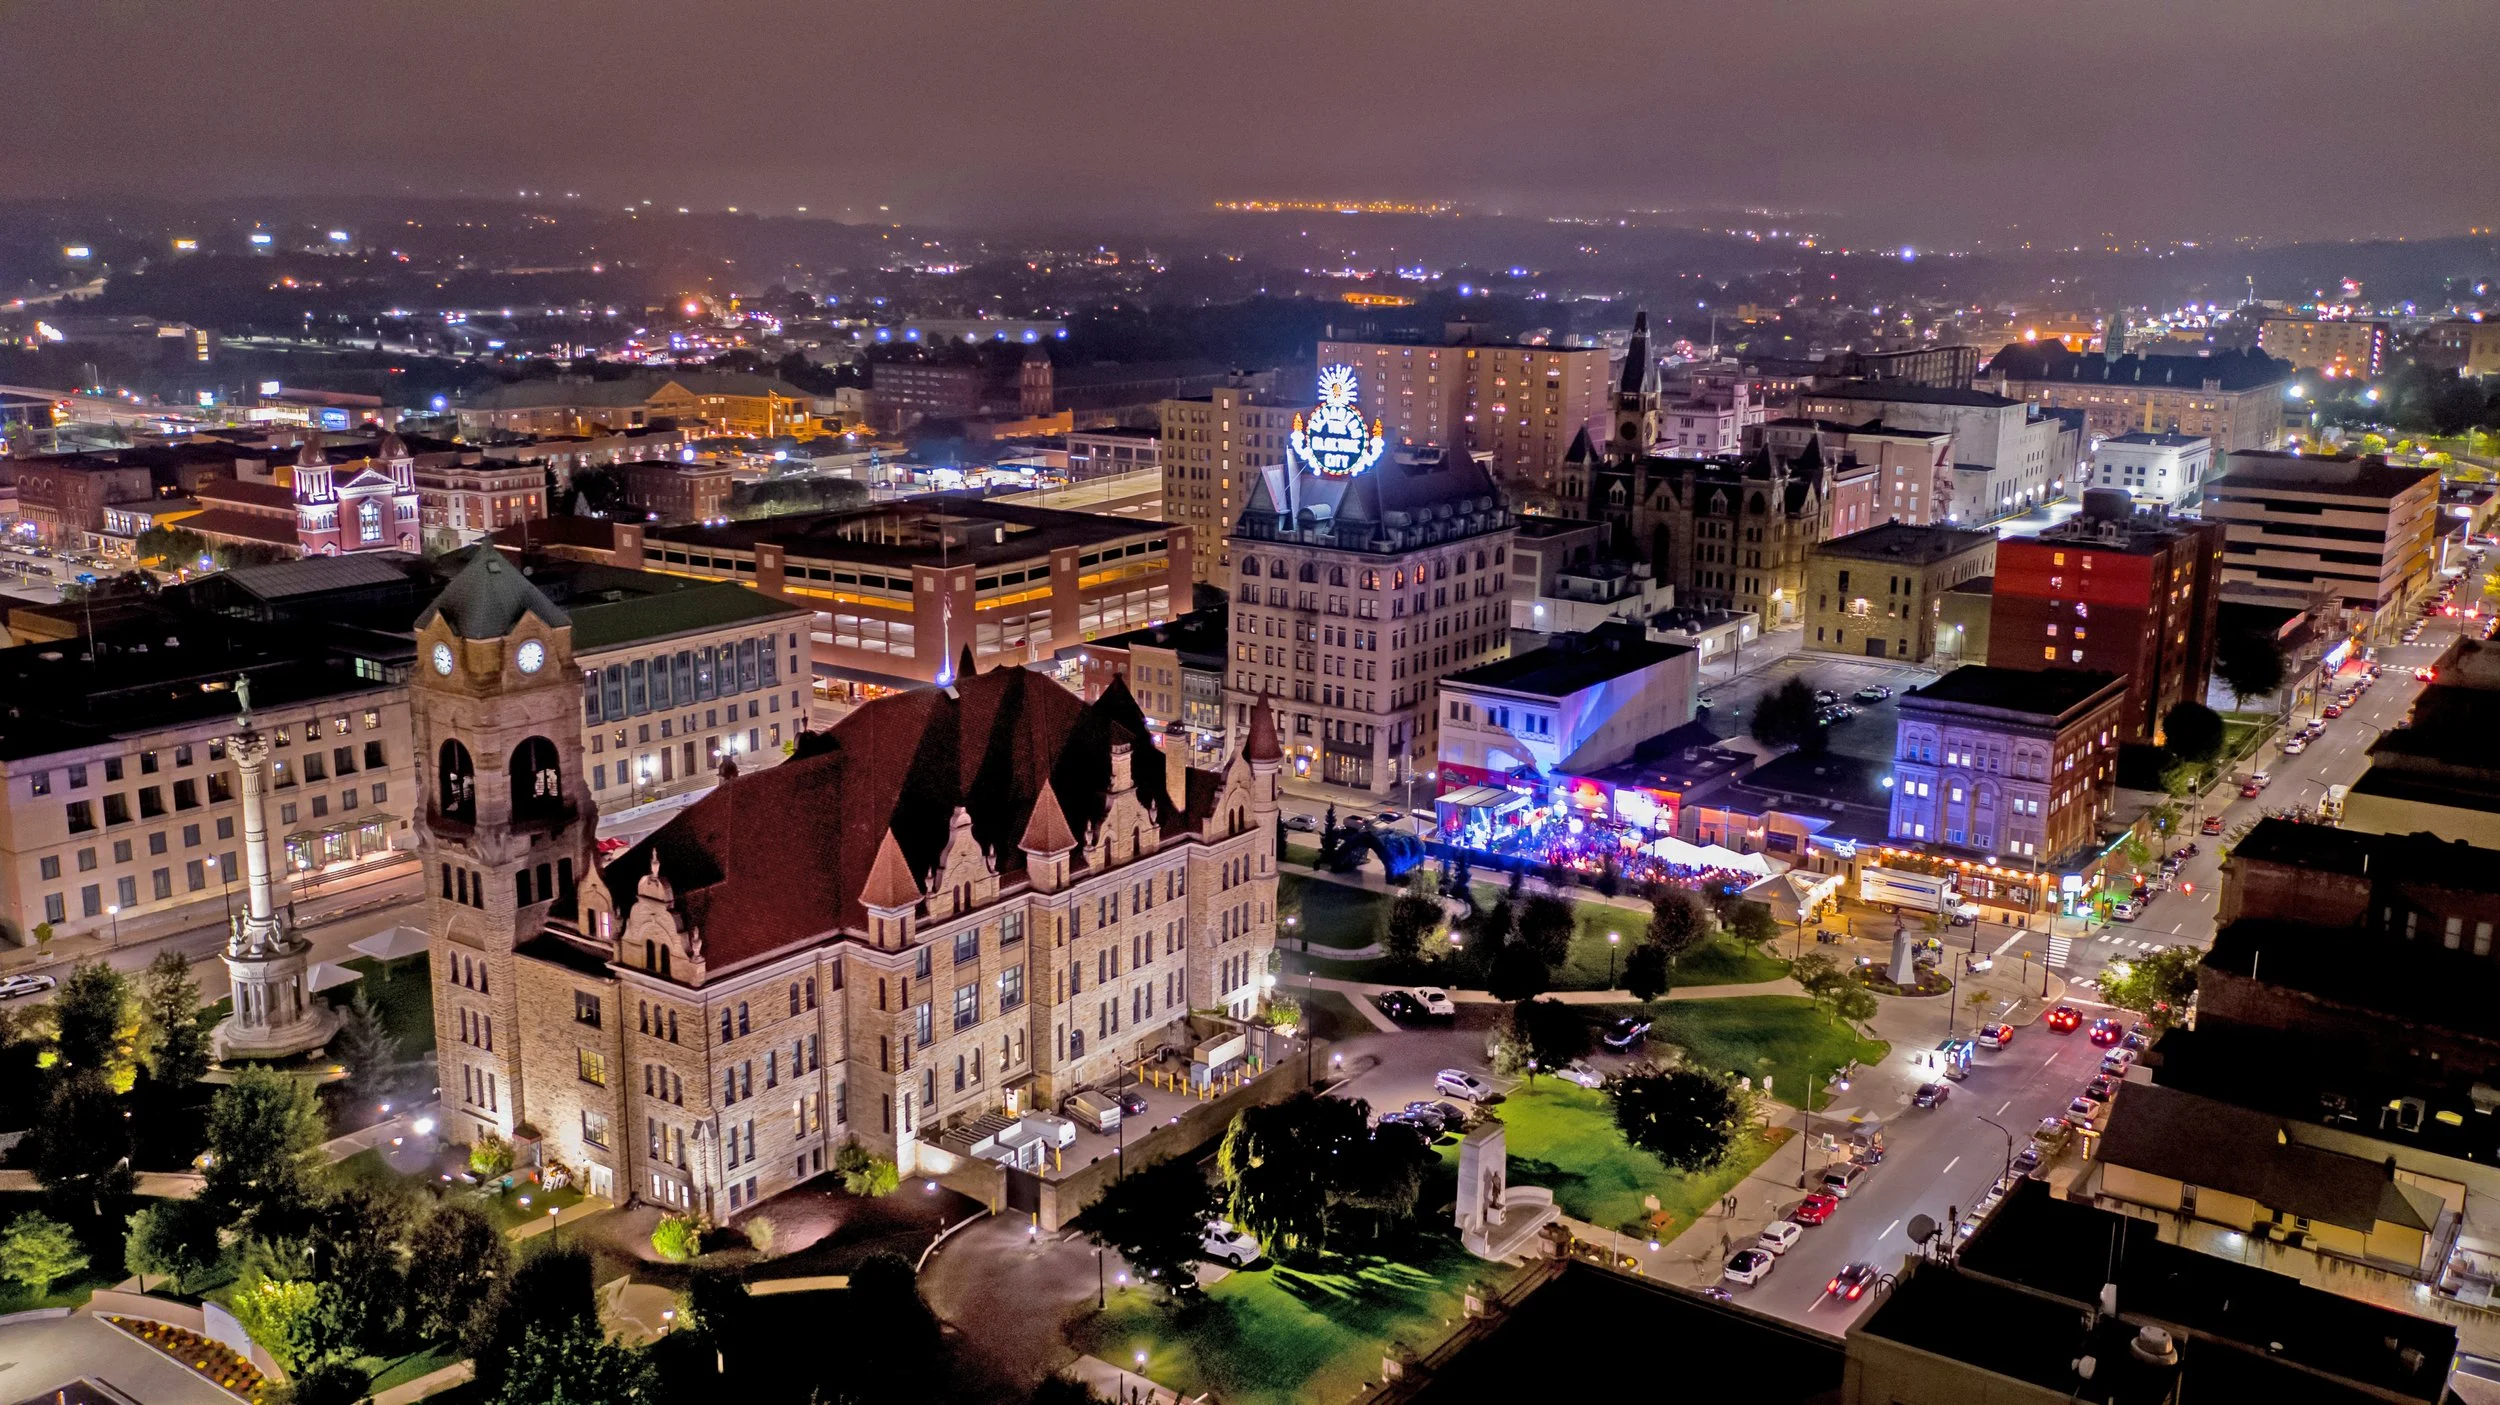
The anchor city of the region, known for The Office, and again, hometown of Joe Biden, Scranton represents the heart of the democratic party of the region. The city has a (relatively for the region) high nonwhite percent of its population at 30.47 percent and an average household income of only $60,847, so it would make a natural base for the democrats. While that is true, in close elections, margins matter and quite frankly the margin hasn’t been holding up well for democrats. In 2012, President Obama won the city by a massive 44.7 percent margin but this margin was slashed to 23.2 percent in 2016. Trump made gains across the entire city interestingly with the exception of the precincts around the University of Scranton, where Clinton made slight gains. Interestingly, the story was totally flipped in 2020 where Biden expanded the democratic margin of victory to 26.7 percent, making gains across most the city, except near the University of Scranton where Trump this time was the one making gains, along with other gains in areas of the city with higher latino populations like in South Side and parts of North Scranton along Providence Road. Unsurprisingly, Biden made his largest gains in the wealthier parts of the city such as East Mountain and Green Ridge where he is originally from. In 2024, Trump cut the democrat’s margin into the teens, with Kamala Harris winning the city by only 18.8 percent–also seeing Trump carry two precincts for the first time in the city–one in West Side and one in the Hill District (interestingly, where the population is 31 percent Asian compared to only 6 percent citywide). Trump made his largest gains in and around the center of the city where there is a concentration of students and racial minorities (two categories that swung heavily towards Trump in 2024). At the same time, Harris improved in one neighborhood, East Mountain, making the 2016-2024 neighborhood swing Democrats + 15.79 percent compared to a citywide swing of Republicans + 4.39 percent–East Mountain is the wealthiest neighborhood in the city.
Nestled close to Lackawanna-Luzerne County border, right next to the local “international” airport, Avoca has a rather small population 2,507 but it is a quite dense town as well, fitting more as a neighborhood in a city like Scranton but separate by political status. If you drive along the Lackawanna and Susquehanna Rivers it is difficult to tell where one town ends and another starts, they morph into one urban entity–though many towns have very strong local pride and would shriek at the idea of unification into one entity. Anyway, Avoca is your typical “valley town,” that is dense with a main street lined with a mixture of delicious Italian and American restaurants and demographically majority white (93 percent) and rather unaffluent (16 percent bachelor’s degree attainment). What makes Avoca interesting is that it has voted with the winner of the Presidential election in the last five elections. In 2012, Obama whallopped Mitt Romney, winning the town by 39.8 percent, a margin common for democrats in many valley towns at the time. In 2016, this all changed when Trump narrowly won the town by three votes (0.2 percent), marking a seismic shift in the town’s politics. Biden temporarily flipped the town back to democrats in 2020, winning it by a narrow 2.1 percentage points before Trump flipped it back red in 2024 by a narrow 1.4 percent margin. Will Trump’s 2024 victory in Avoca only be temporary and will the town continue to vote with the Presidential election winner–who knows?
I spent a couple years of my life when I was younger living in Jefferson Township right outside of Scranton. I always loved the drive to and from home to anywhere because we would always have to drive along the most stunning ridge with some of the coolest views of the region. Route 435 going into Dunmore is a very scenic drive may I say so myself. Jefferson Township represents your typical rural, non-valley town in the region. It is predominantly white (94.7 percent, with moderate income and moderately affluent (with an average household income above average at $114,216 and a college attainment percent lower than average at 30.4 percent). In 2012, the township narrowly voted for Mitt Romney over President Obama by a very narrow margin of 1.2 percent. Trump massively expanded this margin in 2016 to 26.7 percent before Biden cut it back down to 22.7 percent in 2020. In 2024, Trump expanded his margin 26.2 percent–almost that of his 2016 margin. This voting trend is reflected across most of the non-valley parts of the region, being narrowly republican prior to Trump, but seeing Trump massively expand the republican margin of victory. Still, in a sign of perhaps long-term problems for republicans, like across the non-valley at-large, the largest margin of victory for republicans was in 2016 and they haven’t been able to repeat these margins ever since–although the 2012-2024 swing paints a much rosier picture for republicans.
I have actually had the pleasure of calling a quite large plethora of the municipalities of the Wyoming Valley home–including the next town I am going to talk about–Waverly (the town I named my dog after). A historic town with a beyond charming town square with a long underground railroad history, Waverly is the picture of affluence of the region–being the municipality with the highest college attainment level (65.4 percent) and household income ($160,257). The voting trends of Waverly mark the inverse of the voting trends of the region at large–which isn’t surprising considering it is also the inverse of the region socioeconomically. In 2012, Mitt Romney won the town by 4.7 percentage points, but it flipped to democrats in 2016 with Hillary Clinton winning the town by 8.8 percent (marking a 13.5 percent swing leftward). Biden expanded this margin to 15.7 percentage points in 2020 with Trump stopping the bleeding in 2024–holding Harris to a 15.0 percent margin of victory. The voting history of Waverly mirrors that of many affluent towns you find most prominently in the southeast of the state and around Pittsburgh–but it stands in such stark contrast to the rest of the region it finds itself in.
In 2000, Hazleton was 4.85 percent latino, in 2010, it was 37.31 percent latino, in 2020, it was 63.07 percent latino. The demographic transition in the city was as stark as it was swift–and it made it a center of backlash to immigration. In 2006, the city passed the Illegal Immigration Relief Act which penalized landlords and employers who rented to or hired undocumented immigrants. Although the law was largely struck down in federal court, this period cemented Hazleton’s image as a flashpoint in the national immigration debate. But sometimes life likes to play with irony. The whole irony of the situation is as the city got more latino, the city also got substantially more republican–that is when the city was majority white, it voted democratic, and now that it is majority latino, it votes republican. The obvious irony of the situation is that it is the republican party that takes hardline immigration stances, especially on illegal immigration–but as latinos have become an increasingly conservative voting block under the Trump era, their immigration into the city perhaps has sealed the city's republican identity. In 2012, President Obama won the city by 2.8 percentage points, but the city flipped red when Trump won it 4.7 percentage points. Despite Biden making quite substantial gains across the region, the city continued its rightward push into 2020, with Trump expanding his margin to 10.6 percent. In 2024, Trump’s lead exploded to 23.7 percentage points (creating a 19.0 percent swing towards republicans between 2016 and 2024 despite a mere 0.24 percent swing toward republicans region-wide). The voting trends of Hazleton are similar to many majority-Latino midsized cities across the state and region such as Allentown and Reading–that is consistent republican gains throughout the Trump era of politics. Like the rest of the Wyoming Valley, Hazleton will be especially fascinating to watch politically in the next coming years and it will tell us lots about the future of the republican party specifically–that is can they hold onto their gains among latino voters post-Trump and with ICE and immigration enforcement being hot button political issues in today's environment?
Quite frankly, the story of the Wyoming Valley’s recent electoral trends are very encouraging for republicans and very grim for democrats. In spite of that, all four elections used to examine electoral behavior were competitive on a national scale, so it is important to remember that republican gains/democratic losses in this region were largely offset by other regions. While the Wyoming Valley’s recent electoral trends are surely stark, they also aren’t unique. They reflect that republicans gained with nonaffluent white voters and nonwhite voters during the Trump era, and that democrats gained with affluent white voters. Quite frankly, given these facts, it is only natural that Trump made massive gains in the region from the pre-Trump era. I don’t know if these gains will stick with republicans in the future or whether the region will return to its democratic roots when Trump inevitably goes–but it will be fascinating to see. If you read all of this I wanted to offer one more thank you for taking the time to do so–it truly does mean a lot. I think my next articles will be on Allegheny county (Pittsburgh)–the city where I currently go to college–then perhaps Bucks County due to its fascinating political trends and I know a bunch of people from there. Again thank you for reading this.